Free macOS Menu Bar App for RAM, CPU, and System Health
A tiny, private macOS menu bar app reveals memory pressure, RAM and CPU hogs, and key system health stats—without graphs, bloat, or network access.

🚀 Senior Architect | SRE & Database Expert | AI Orchestrator 👋 Building the future at the speed of thought. ⚡️ I don't just write code; I architect high-performance, bulletproof ecosystems. With a foundation in Systems Engineering and a mastery of Go and TypeScript, I bridge the gap between heavy-duty backend reliability and seamless, high-conversion frontends.
What’s really using your Mac — at a glance.
mtop is a tiny macOS menu bar app that answers the questions Activity Monitor buries: is your Mac under memory pressure, which apps are eating RAM and CPU, and a few system facts worth knowing. One honest dot in your menu bar; a clean list when you click it. No graphs, no history, no bloat — and no network. Nothing ever leaves your Mac.
Download for macOS → Free · macOS 14 or later · Signed & notarized by Apple
Three questions, answered honestly
Is my Mac under memory pressure?
A single dot in your menu bar — green, amber, or red — tells you the truth at a glance, backed by the same pressure signal macOS uses internally. No misleading “90% used” (on a Mac, that’s the normal, healthy state). Click it and you get one plain-English sentence, not a wall of numbers.
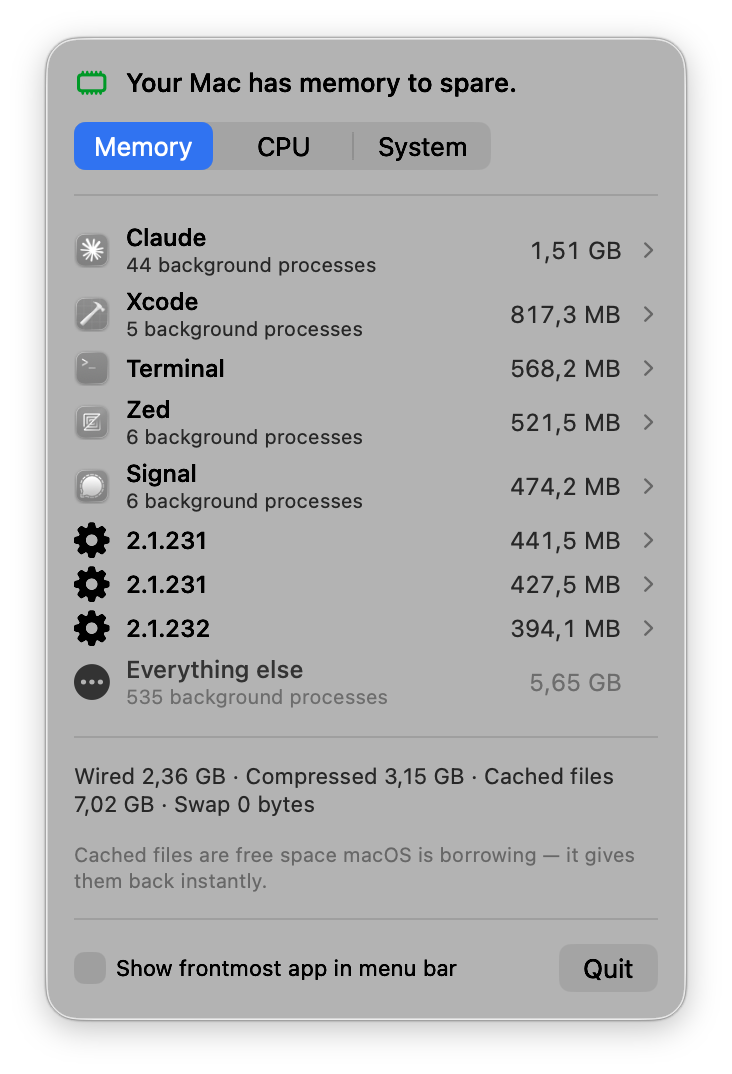
Which apps are eating my RAM — and CPU?
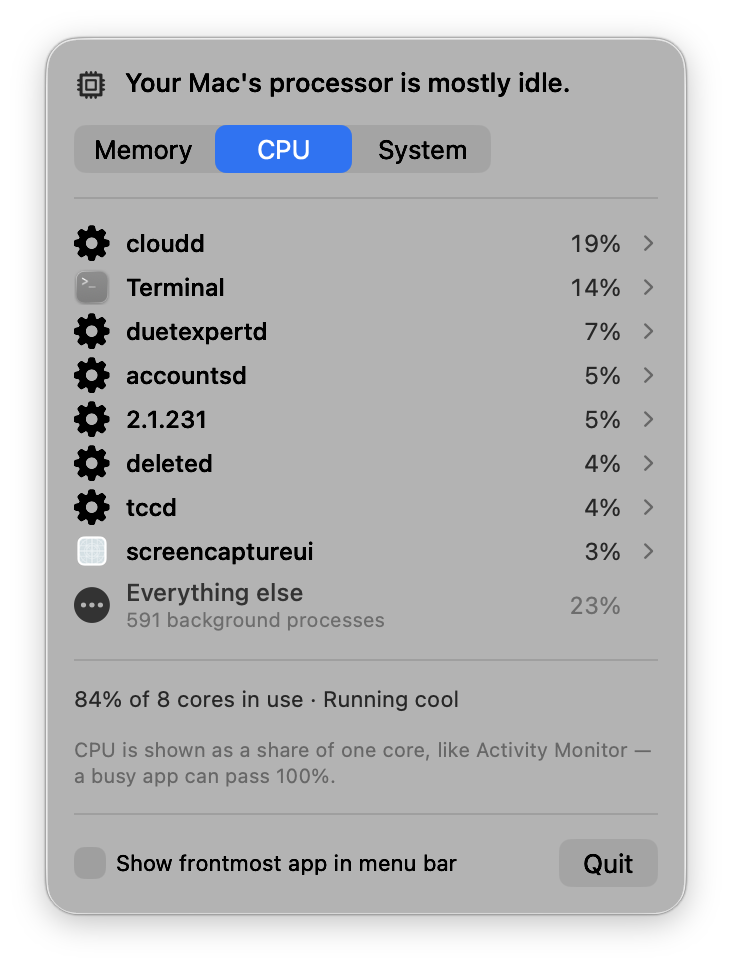
A clean list of the apps actually responsible, ranked by their real memory footprint — the same number Activity Monitor shows — with an app’s dozens of helper processes folded into one row. Flip a toggle and the same list re-sorts by CPU, so a runaway background process is as easy to spot as a memory hog.
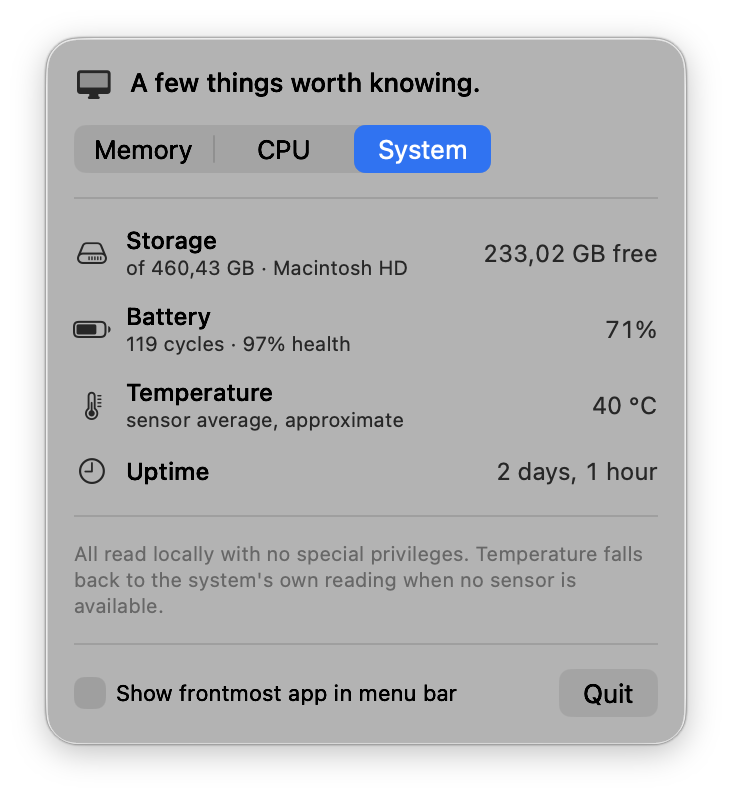
A few things worth knowing
A quiet System tab rounds it out: storage free, battery health, temperature, and uptime — each a single, glanceable line. Read-only, no clutter.
Private by design
This is the part that matters most — and it’s not an afterthought, it’s the whole posture of the app:
- No network code. None. mtop has no sockets, no analytics, no crash reporting, and no update checker that phones home. Your process names and numbers never leave your Mac.
- Nothing written to disk except a single on/off preference.
- No account, no cloud, no tracking — ever.
Because mtop processes no personal data and transmits nothing, it sits entirely outside the scope of GDPR — the cleanest possible position for a utility that lives this close to your system.
Honest numbers, not scary ones
Most memory monitors mislead you by accident. mtop refuses to:
- No “% of RAM used.” macOS deliberately keeps memory full of reclaimable cache and hands it back the instant anything needs it — so “90% used” is the healthy state, not a warning. mtop shows the kernel’s real pressure verdict instead.
- Never RSS. Summing “Real Memory” across processes double-counts shared
frameworks and can exceed your physical RAM. mtop only ever sums
phys_footprint— the honest per-process ledger the kernel itself uses to decide what to reclaim.
Fewer numbers. The right numbers.
Download
Requires macOS 14 (Sonoma) or later. Signed and notarized by Apple, so it opens with no security warnings — just download, drag to Applications, and it lives in your menu bar.
Not on the Mac App Store, and that’s deliberate: the App Store sandbox would forbid mtop from seeing your other apps’ memory and CPU — which is the entire point of the app.
mtop · No data leaves your Mac.