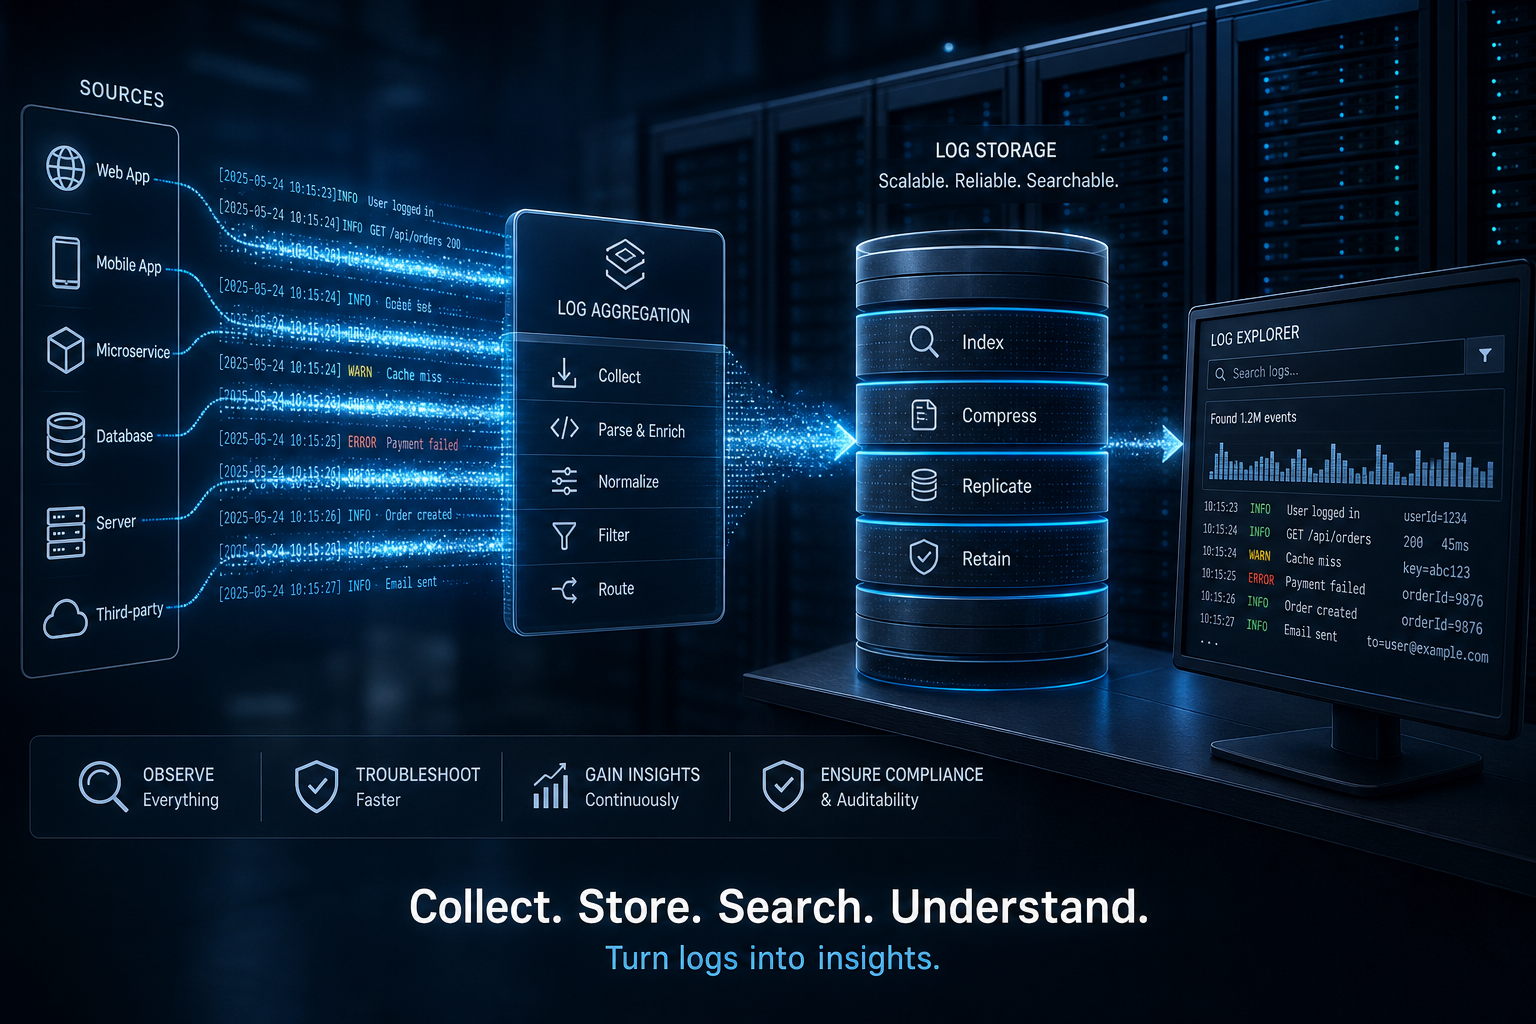
A log line is a sentence about something that happened.
If what you have is a document, a payload, or a number you would rather graph, it belongs somewhere else. Everything below follows from that one distinction.
1. Decide where it goes before you write it
Most logging problems are routing problems. Something that was never a log line got written as one, because writing a log line is the easiest thing to do from inside a function. The fix is a two-second decision made before the call.
| What you have | Where it belongs | Why |
|---|---|---|
| Something happened, and a human might need to read about it | Log line | Searchable text, cheap in volume, keyed by service and severity |
| A number you would put on a graph — duration, count, queue depth, retries | Metric | Aggregated at write time. A year of a counter costs less than an hour of log lines |
| How a request moved through several services, and where the time went | Trace | Built for causality and latency. Spans carry attributes; logs cannot express a call tree |
| A payload — request body, response body, generated file, export | Object storage | Designed for blobs. Log the key, not the contents |
| Business facts you must be able to reconstruct or correct later | Your own store | A durable, queryable record with a schema. See §3 — this is the one people get wrong |
The rule of thumb: if you would be upset to lose it, it does not belong in logs. Logs are the one telemetry signal that is routinely sampled, truncated, rate-limited and aged out. That is a reasonable trade for diagnostics. It is a terrible trade for anything you are accountable for.
2. Levels mean an audience, not a volume dial
A level is a promise about who reads the line and how urgently. Choose it by asking “who is this for?”, never by how interesting the line felt while writing it.
| Level | Who reads it | The test | Lifetime |
|---|---|---|---|
ERROR |
On-call, now | An operation failed and somebody must decide what to do | Long |
WARN |
On-call, later | Handled, but the fact it happened is itself information | Long |
INFO |
Anyone reconstructing what the service did | A state change a colleague would ask about | Medium |
DEBUG |
The developer, while debugging | Only useful if you already have the source open | Days |
The two failure modes are symmetrical and both common. Everything at INFO makes the level useless as a filter — if it is all important, none of it is. Everything at DEBUG, left on in production, is the one that shows up on the storage bill.
Measured, on a real estate
85% of one platform’s application log volume was DEBUG, running continuously in production, retained for over a year. Nobody had read any of it. It had never been switched off after a release, and nothing surfaced its cost to the teams producing it.
DEBUG in production is not automatically wrong — but it should be a deliberate, temporary, per-service decision with a date attached, not the resting state.
3. If you use DEBUG logs to fix data, you need something else
This is worth its own section, because it is the most expensive misuse of logging and the one that feels most reasonable from the inside.
The pattern goes like this. A record ends up wrong. Somebody greps the logs, finds a DEBUG line containing the serialised request from three weeks ago, and reconstructs what should have happened. It works, so it becomes the method. And because it works, the DEBUG logging can never be turned off, and it grows to include ever more of the payload, because next time the missing field might be the one you need.
What that team actually needs is an audit trail, and they have built a bad one by accident.
The differences are not cosmetic:
| DEBUG logs | A purpose-built event store | |
|---|---|---|
| Schema | Whatever the format string happened to contain | Explicit, versioned, validated |
| Queryable by | Text search, if you can guess the wording | Entity id, actor, time range, event type |
| Guaranteed? | No. Sampled, truncated, rate-limited, aged out | Yes. It is a database write in the transaction |
| Retention | Whatever the platform team set | Whatever the business and the regulator require |
| Volume | Every line, all the time, from everywhere | Only meaningful business events |
| In an audit | Not evidence | Evidence |
The small custom application, done right
This is usually a genuinely small piece of work, and far smaller than people fear — because you are not building a general logging platform, you are recording a short list of things the business actually cares about.
An append-only table is often the whole thing:
-- one row per business-meaningful event, written in the same
-- transaction as the change it describes
event_id        uuid        primary key
occurred_at     timestamptz not null
entity_type     text        not null   -- 'invoice', 'terminal', 'merchant'
entity_id       text        not null   -- the thing this happened to
event_type      text        not null   -- 'export.submitted', 'export.rejected'
actor           text                   -- user, service, scheduled job
correlation_id  text                   -- ties it to logs and traces
payload_ref     text                   -- object storage key, if there is a document
summary         jsonb                  -- the few fields you actually query on
Three properties make it worth building:
- It answers the real question directly. “What happened to invoice 97665?” becomes one indexed query, not a text search across a month of log files.
- It is small. Business events are orders of magnitude rarer than log lines. A service emitting millions of DEBUG lines a day might emit a few thousand real events.
- It lets DEBUG go back to being DEBUG. Once the durable record exists, debug logging can be switched off in production without anyone losing a capability — which is usually the actual blocker.
How to tell you are in this trap
Ask the team: “if we turned DEBUG off in production tomorrow, what would you no longer be able to do?”
If the answer is “debug a problem”, that is fine — turn it on when needed. If the answer describes a business capability — correcting records, answering a customer, satisfying an auditor, reconciling with a partner — then debug logs are load-bearing infrastructure, and they are the wrong material for it.
4. What a good log line looks like
Log the identifiers and the outcome. Not the object.
Don’t — 180 KB, once per invoice:
log.Debug("Sending invoice: {Request}",
    JsonSerializer.Serialize(request));

log.Debug("Response: {Response}",
    JsonSerializer.Serialize(response));
Do — ~180 bytes, and more useful:
log.Information(
    "Invoice export {InvoiceId} to {Partner} {Outcome} in {ElapsedMs}ms (payload {PayloadRef})",
    invoiceId, partner, outcome, elapsedMs, payloadRef);
The second version is a thousand times smaller and answers more questions, because every value in it is something you might filter or group by. The payload has not been lost — it is in object storage under payloadRef, where it is cheaper, and retrievable by anyone who needs it.
Rules that survive contact with production
- Use structured logging. Named parameters, not string concatenation. It costs nothing at the call site and turns every value into something searchable.
- One event, one line. Do not log “starting X” and “finished X” unless the gap between them genuinely matters — that is what a duration field is for.
- Never log secrets, tokens, card data or personal data. Logs are copied, forwarded and retained in more places than you expect. Anything sensitive should be redacted at the call site, not downstream.
- No stack traces at INFO. A stack trace is an ERROR-level artefact. If it is not an error, you do not need the trace.
- Log the identifier, always. A line saying an operation failed, without saying which one, costs storage and delivers nothing.
5. Size, and what a big line actually costs
Log stores group entries into blocks — typically 256 KB — and compress each block as a unit. A block is also the smallest thing a query can decompress. So the question that decides cost is simply: how many lines fit in a block?
| Line size | Lines per block | Verdict | What it means in practice |
|---|---|---|---|
| < 1 KB | 250 – 2,500 | Ideal | Compression works across repeated structure. Where log stores are designed to operate |
| 1 – 8 KB | 32 – 250 | Fine | Stack traces live here comfortably |
| 8 – 64 KB | 4 – 32 | Wasteful | Acceptable if rare. A problem if routine |
| 64 – 256 KB | 1 – 4 | Degraded | Compression largely gone. Queries decompress a full block per line |
| ≥ 256 KB | 1 | Rejected | Past the default per-entry limit. One line per block breaks the storage model |
Two costs compound as lines grow. Compression collapses, because log lines are enormously repetitive — same timestamp format, same level, same logger — and compression exploits redundancy between lines in a block. One line per block leaves nothing to compress against. And query cost per useful line explodes: a filter touching that block decompresses the full 256 KB to evaluate a single entry, where the same work would have evaluated two thousand normal ones.
Why the bill arrives late
None of this cost is paid at write time, which is why nobody notices. Ingesting a 400 KB line is fine. The bill arrives months later, spread thinly across every query whose time range happens to include that block — as latency nobody can attribute to anything.
What a healthy service looks like
Measured across a production application estate — these are real percentiles, and they are what to aim for:
| Median line | 105 B |
| 90th percentile | 166 B |
| 99th percentile | 1.1 KB |
| 99.9th percentile | 18 KB |
Ninety-nine percent of lines under about a kilobyte, with a tail that reaches into the tens of kilobytes for genuine stack traces. That is a well-behaved service.
On the same estate, the largest single log line ever recorded was 438 KB — roughly 77,000 words, the length of a short novel, written as one entry. That is not a tail; that is a different activity wearing logging’s clothes.
6. One identifier, everywhere
Telemetry is only worth having if the pieces join up. A single correlation identifier — generated at the edge, propagated through every call, and attached to everything — is what turns four separate systems into one investigation.
| Signal | Carries | Gets you |
|---|---|---|
| Trace | trace id, span ids | Where the time went and which service failed |
| Log line | trace id, entity id | What the code said about it |
| Metric | service, endpoint, outcome | Whether it is happening to everyone or just this one |
| Event store | correlation id, entity id | What the business record says happened |
| Object storage | key referenced from the log line | The payload, when you genuinely need it |
Without that shared identifier, each of these is an island and every investigation starts with guessing timestamps. With it, one id pasted into a search returns the whole story. It is the single highest-return thing on this page, and it is usually a middleware registration and a logging-context call.
7. Retention is three questions, not one
“How long do we keep logs?” conflates three separate requirements with very different costs. Answer them separately and the bill usually drops without anyone losing anything.
| Question | Typical answer | Where it lives |
|---|---|---|
| How far back must I be able to search interactively? | Weeks to ~3 months | Indexed log store — the expensive tier |
| How far back must the data exist, retrievable if asked? | 1 – 7 years | Compressed files or object storage — cheap, not indexed |
| How far back must I prove what the business did? | Per regulation | The event store — a database, backed up like one |
The common mistake is answering all three with the search tier, because it is the one with a nice interface. That is the most expensive possible storage for data nobody will query, and it is why log platforms grow without bound.
The mirror-image mistake matters more, though: if a category of log has no archive, its search retention is its only retention. Cutting a search window from twelve months to three sounds like a tuning change, but for anything that exists nowhere else it is permanent deletion. Check what has an archive behind it before shortening any window.
8. Checklist for a service
A service is ready to run in production when all of these are true.
- Log lines are structured, with named fields rather than interpolated strings.
- Every line carries a correlation id and the identifier of the thing it concerns.
- No serialised request, response or object graph is written to a log at any level.
- Payloads worth keeping go to object storage; the log carries the key.
- Levels reflect audience: ERROR and WARN mean somebody should look.
- DEBUG in production is off by default, and switching it on has a date attached.
- Anything the business must reconstruct is written to a durable event store, not inferred from logs.
- Nothing sensitive — credentials, tokens, card data, personal data — is logged, redaction happening at the call site.
- Durations, counts and rates are metrics, not log lines to be counted later.
- Typical lines are well under a kilobyte; anything over 64 KB is a defect, not a tuning matter.
A log line is a sentence. Everything larger has a better home — and the service that finds it usually gets faster, cheaper and easier to debug in the same change.

Madalin
AI integrator🚀 Senior Architect | SRE & Database Expert | AI Orchestrator 👋 Building the future at the speed of thought. ⚡️ I don't just write code; I architect high-performance, bulletproof ecosystems. With a foundation in Systems Engineering and a mastery of Go and TypeScript, I bridge the gap between heavy-duty backend reliability and seamless, high-conversion frontends.
Continue the conversation
If this article reflects the challenges your organisation is navigating, explore more practical guidance across Madalin.